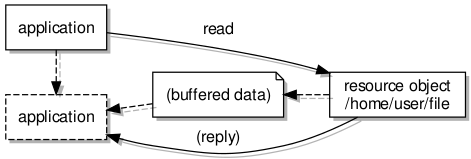
A surprising three years have passed since my last article about my efforts to make a general-purpose filesystem accessible to programs running in the L4 (or L4Re) Runtime Environment. Some of that delay was due to a lack of enthusiasm about blogging for various reasons, much more was due to having much of my time occupied by full-time employment involving other technologies (Python and Django mostly, since you ask) that limited the amount of time and energy that could be spent focusing on finding my way around the intricacies of L4Re.
In fact, various other things I looked into in 2019 (or maybe 2018) also went somewhat unreported. I looked into trying to port the “user mode” (UX) variant of the Fiasco.OC microkernel to the MIPS architecture used by the MIPS Creator CI20. This would have allowed me to conveniently develop and test L4Re programs in the GNU/Linux environment on that hardware. I did gain some familiarity with the internals of that software, together with the Linux ptrace mechanism, making some progress but not actually getting to a usable conclusion. Recommendations to use QEMU instead led me to investigate the situation with KVM on MIPS, simply to try and get half-way reasonable performance: emulation is otherwise rather slow.
You wouldn’t think that running KVM on anything other than Intel/AMD or ARM architectures were possible if you only read the summary on the KVM project page or the Debian Wiki’s KVM page. In fact, KVM is supported on multiple architectures including MIPS, but the latest (and by now very old 3.18) “official” kernel for the CI20 turned out to be too old to support what I needed. Or at least, I tried to get it to work but even with all the necessary configuration to support “trap and emulate” on a CPU without virtualisation support, it seemed to encounter instructions it did not emulate. As the hot summer of 2019 (just like 2018) wound down, I switched back to using my main machine at the time: an ancient Pentium 4 system that I didn’t want heating the apartment; one that could run QEMU rather slowly, albeit faster than the CI20, but which gave me access to Fiasco.OC-UX once again.
Since then, the hard yards of upstreaming Linux kernel device support for the CI20 has largely been pursued by the ever-patient Nikolaus Schaller, vendor of the Letux 400 mini-notebook and hardware designer of the Pyra, and a newer kernel capable of running KVM satisfactorily might now be within reach. That is something to be investigated somewhere in the future.
Back to the Topic
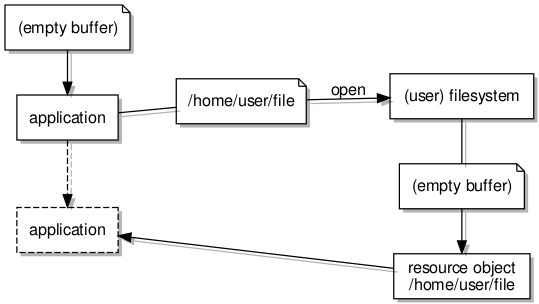
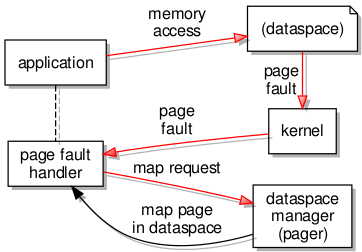
In my last article on the topic of this article, I had noted that to take advantage of various features that L4Re offers, I would need to move on from providing a simple mechanism to access files through read and write operations, instead embracing the memory mapping paradigm that is pervasive in L4Re, adopting such techniques to expose file content to programs. This took us through a tour of dataspaces, mapping, pages, flexpages, virtual memory and so on. Ultimately, I had a few simple programs working that could still read and write to files, but they would be doing so via a region of memory where pages of this memory would be dynamically “mapped” – made available – and populated with file content. I even integrated the filesystem “client” library with the Newlib C library implementation, but that is another story.
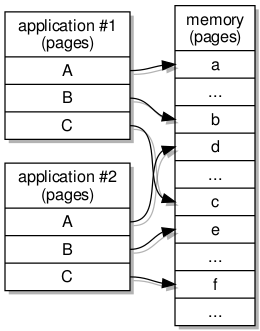
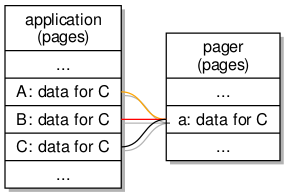
Nothing is ever simple, though. As I stressed the test programs, introducing concurrent access to files, crashes would occur in the handling of the pages issued to the clients. Since I had ambitiously decided that programs accessing the same files would be able to share memory regions assigned to those files, with two or more programs being issued with access to the same memory pages if they happened to be accessing the same areas of the underlying file, I had set myself up for the accompanying punishment: concurrency errors! Despite the heroic help of l4-hackers mailing list regulars (Frank and Jean), I had to concede that a retreat, some additional planning, and then a new approach would be required. (If nothing else, I hope this article persuades some l4-hackers readers that their efforts in helping me are not entirely going to waste!)
Prototyping an Architecture
In some spare time a couple of years ago, I started sketching out what I needed to consider when implementing such an architecture. Perhaps bizarrely, given the nature of the problem, my instinct was to prototype such an architecture in Python, running as a normal program on my GNU/Linux system. Now, Python is not exactly celebrated for its concurrency support, given the attention its principal implementation, CPython, has often had for a lack of scalability. However, whether or not the Python implementation supports running code in separate threads simultaneously, or whether it merely allows code in threads to take turns running sequentially, the most important thing was that I could have code happily running along being interrupted at potentially inconvenient moments by some other code that could conceivably ruin everything.
Fortunately, Python has libraries for threading and provides abstractions like semaphores. Such facilities would be all that was needed to introduce concurrency control in the different program components, allowing the simulation of the mechanisms involved in acquiring memory pages, populating them, issuing them to clients, and revoking them. It may sound strange to even consider simulating memory pages in Python, which operates at another level entirely, and the issuing of pages via a simulated interprocess communication (IPC) mechanism might seem unnecessary and subject to inaccuracy, but I found it to be generally helpful in refining my approach and even deepening my understanding of concepts such as flexpages, which I had applied in a limited way previously, making me suspect that I had not adequately tested the limits of my understanding.
Naturally, L4Re development is probably never done in Python, so I then had the task of reworking my prototype in C++. Fortunately, this gave me the opportunity to acquaint myself with the more modern support in the C++ standard libraries for threading and concurrency, allowing me to adopt constructs such as mutexes, condition variables and lock guards. Some of this exercise was frustrating: C++ is, after all, a lower-level language that demands more attention to various mundane details than Python does. It did suggest potential improvements to Python’s standard library, however, although I don’t really pay any attention to Python core development any more, so unless someone else has sought to address such issues, I imagine that Python will gain even more in the way of vanity features while such genuine deficiencies and omissions remain unrecognised.
Transplanting the Prototype
Upon reintroducing this prototype functionality into L4Re, I decided to retain the existing separation of functionality into various libraries within the L4Re build system – ones for filesystem clients, servers, IPC – also making a more general memory abstractions library, but I ultimately put all these libraries within a single package. At some point, it is this package that I will be making available, and I think that it will be easier to evaluate with all the functionality in a single bundle. The highest priority was then to test the mechanisms employed by the prototype using the same concurrency stress test program, this originally being written in Python, then ported to C++, having been used in my GNU/Linux environment to loosely simulate the conditions under L4Re.
This stress testing exercise eventually ended up working well enough, but I did experience issues with resource limits within L4Re as well as some concurrency issues with capability management that I should probably investigate further. My test program opens a number of files in a number of threads and attempts to read various regions of these files over and over again. I found that I would run out of capability slots, these tracking the references to other components available to a task in L4Re, and since each open file descriptor or session would require a slot, as would each thread, I had to be careful not to exceed the default budget of such slots. Once again, with help from another l4-hackers participant (Philipp), I realised that I wasn’t releasing some of the slots in my own code, but I also learned that above a certain number of threads, open files, and so on, I would need to request more resources from the kernel. The concurrency issue with allocating individual capability slots remains unexplored, but since I already wrap the existing L4Re functionality in my own library, I just decided to guard the allocation functionality with semaphores.
With some confidence in the test program, which only accesses simulated files with computed file content, I then sought to restore functionality accessing genuine files, these being the read-only files already exposed within L4Re along with ext2-resident files previously supported by my efforts. The former kind of file was already simulated in the prototype in the form of “host” files, although L4Re unhelpfully gives an arbitary (counter) value for the inode identifiers for each file, so some adjustments were required. Meanwhile, introducing support for the latter kind of file led me to update the bundled version of libext2fs I am using, refine various techniques for adapting the upstream code, introduce more functionality to help use libext2fs from my own code (since libext2fs can be rather low-level), and to consider the broader filesystem support architecture.
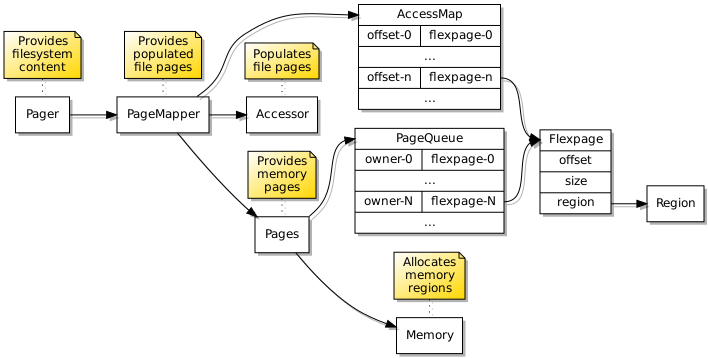
Here is the general outline of the paging mechanism supporting access to filesystem content:

The data structures employed to provide filesystem content to programs.
It is rather simplistic, and I have practically ignored complicated page replacement algorithms. In practice, pages are obtained for use when a page fault occurs in a program requesting a particular region of file content, and fulfilment of this request will move a page to the end of a page queue. Any independent requests for pages providing a particular file region will also reset the page’s position in the queue. However, since successful accesses to pages will not cause programs to repeatedly request those pages, eventually those pages will move to the front of the queue and be reclaimed.
Without any insight into how much programs are accessing a page successfully, relying purely on the frequency of page faults, I imagine that various approaches can be adopted to try and assess the frequency of accesses, extrapolating from the page fault frequency and seeking to “bias” or “weight” pages with a high frequency of requests so that they move through the queue more slowly or, indeed, move through a queue that provides pages less often. But all of this is largely a distraction from getting a basic mechanism working, so I haven’t directed any more time to it than I have just now writing this paragraph!
Files and File Sessions
While I am quite sure that I ended up arriving at a rather less than optimal approach for the paging architecture, I found that the broader filesystem architecture also needed to be refined further as I restored the functionality that I had previously attempted to provide. When trying to support shared access to file content, it is appropriate to implement some kind of registry of open files, these retaining references to objects that are providing access to each of the open files. Previously, this had been done in a fairly simple fashion, merely providing a thread-safe map or dictionary yielding the appropriate file-related objects when present, otherwise permitting new objects to be registered.
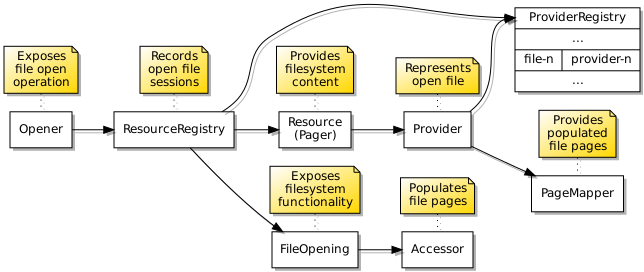
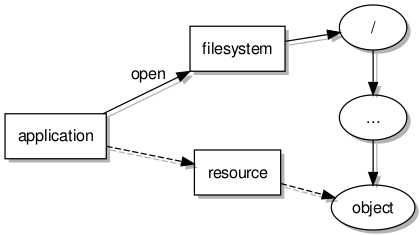
Again, concurrency issues needed closer consideration. When one program requests access to a file, it is highly undesirable for another program to interfere during the process of finding the file, if it exists already, or creating the file, if it does not. Therefore, there must be some kind of “gatekeeper” for the file, enforcing sequential access to filesystem operations involving it and ensuring that any preparatory activities being undertaken to make a file available, or to remove a file, are not interrupted or interfered with. I came up with an architecture looking like this, with a resource registry being the gatekeeper, resources supporting file sessions, providers representing open files, and accessors transferring data to and from files:

The data structures employed to provide access to the underlying filesystem objects.
I became particularly concerned with the behaviour of the system around file deletion. On Unix systems, it is fairly well understood that one can “unlink” an existing file and keep accessing it, as long as a file descriptor has been retained to access that file. Opening a file with the same name as the unlinked file under such circumstances will create a new file, provided that the appropriate options are indicated, or otherwise raise a non-existent file error, and yet the old file will still exist somewhere. Any new file with the same name can be unlinked and retained similarly, and so on, building up a catalogue of old files that ultimately will be removed when the active file descriptors are closed.
I thought I might have to introduce general mechanisms to preserve these Unix semantics, but the way the ext2 filesystem works largely encodes them to some extent in its own abstractions. In fact, various questions that I had about Unix filesystem semantics and how libext2fs might behave were answered through the development of various test programs, some being normal programs accessing files in my GNU/Linux environment, others being programs that would exercise libext2fs in that environment. Having some confidence that libext2fs would do the expected thing leads me to believe that I can rely on it at least for some of the desired semantics of the eventual system.
The only thing I really needed to consider was how the request to remove a file when that file was still open would affect the “provider” abstraction permitting continued access to the file contents. Here, I decided to support a kind of deferred removal: if a program requested the removal of a file, the provider and the file itself would be marked for removal upon the final closure of the file, but the provider for the file would no longer be available for new usage, and the file would be unlinked; programs already accessing the file would continue to operate, but programs opening a file of the same name would obtain a new file and a new provider.
The key to this working satisfactorily is that libext2fs will assign a new inode identifier when opening a new file, whereas an unlinked file retains its inode identifier. Since providers are indexed by inode identifier, and since libext2fs translates the path of a file to the inode identifier associated with the file in its directory entry, attempts to access a recreated file will always yield the new inode identifier and thus the new file provider.
Pipes, Listings and Notifications
In the previous implementation of this filesystem functionality, I had explored some other aspects of accessing a filesystem. One of these was the ability to obtain directory listings, usually exposed in Unix operating systems by the opendir and readdir functions. The previous implementation sought to expose such listings as files, this in an attempt to leverage the paging mechanisms already built, but the way that libext2fs provides such listing information is not particularly compatible with the random-access file model: instead, it provides something more like an iterator that involves the repeated invocation of a callback function, successively supplying each directory entry for the callback function to process.
For this new implementation, I decided to expose directory listings via pipes, with a server thread accessing the filesystem and, in that callback function, writing directory entries to one end of a pipe, and with a client thread reading from the other end of the pipe. Of course, this meant that I needed to have an implementation of pipes! In my previous efforts, I did implement pipes as a kind of investigation, and one can certainly make this very complicated indeed, but I deliberately kept this very simple in this current round of development, merely having a couple of memory regions, one being used by the reader and one being used by the writer, with each party transferring the regions to the other (and blocking) if they find themselves respectively running out of content or running out of space.
One necessary element in making pipes work is that of coordinating the reading and writing parties involved. If we restrict ourselves to a pipe that will not expand (or even not expand indefinitely) to accommodate more data, at some point a writer may fill the pipe and may then need to block, waiting for more space to become available again. Meanwhile, a reader may find itself encountering an empty pipe, perhaps after having read all available data, and it may need to block and wait for more content to become available again. Readers and writers both need a way of waiting efficiently and requesting a notification for when they might start to interact with the pipe again.
To support such efficient blocking, I introduced a notifier abstraction for use in programs that could be instantiated and a reference to such an instance (in the form of a capability) presented in a subscription request to the pipe endpoint. Upon invoking the wait operation on a notifier, the notifier will cause the program (or a thread within a program) to wait for the delivery of a notification from the pipe, this being efficient because the thread will then sleep, only to awaken if a message is sent to it. Here is how pipes make use of notifiers to support blocking reads and writes:

The use of notifications when programs communicate via a pipe.
A certain amount of plumbing is required behind the scenes to support notifications. Since programs accessing files will have their own sessions, there needs to be a coordinating object representing each file itself, this being able to propagate notification events to the users of the file concerned. Fortunately, I introduced the notion of a “provider” object in my architecture that can act in such a capacity. When an event occurs, the provider will send a notification to each of the relevant notifier endpoints, also providing some indication of the kind of event occurring. Previously, I had employed L4Re’s IRQ (interrupt request) objects as a means of delivering notifications to programs, but these appear to be very limited and do not allow additional information to be conveyed, as far as I can tell.
One objective I had with a client-side notifier was to support waiting for events from multiple files or streams collectively, instead of requiring a program to have threads that wait for events from each file individually, thus attempting to support the functionality provided by Unix functions like select and poll. Such functionality relies on additional information indicating the kind of event that has occurred. The need to wait for events from numerous sources also inverts the roles of client and server, with a notifier effectively acting like a server but residing in a client program, waiting for messages from its clients, these typically residing in the filesystem server framework.
Testing and Layering
Previously, I found that it was all very well developing functionality, but only through a commitment to testing it would I discover its flaws. When having to develop functionality at a number of levels in a system at the same time, testing generally starts off in a fairly limited fashion. Initially, I reintroduced a “block” server that merely provides access to a contiguous block of data, this effectively simulating storage device access that will hopefully be written at some point, and although genuine filesystem support utilises this block server, it is reassuring to be able to know whether it is behaving correctly. Meanwhile, for programs to access servers, they must send requests to those servers, assisted by a client library that provides support for such interprocess communication at a fairly low level. Thus, initial testing focused on using this low-level support to access the block server and verify that it provides access to the expected data.
On top of the lowest-level library functionality is a more usable level of “client” functions that automates the housekeeping needing to be done so that programs may expect an experience familiar to that provided by traditional C library functionality. Again, testing of file operations at that level helped to assess whether library and server functionality was behaving in line with expectations. With some confidence, the previously-developed ext2 filesystem functionality was reintroduced and updated. By layering the ext2 filesystem server on top of the block server, the testing activity is actually elevated to another level: libext2fs absolutely depends on properly functioning access to the block device; otherwise, it will not be able to perform even the simplest operations on files.
When acquainting myself with libext2fs, I developed a convenience library called libe2access that encapsulates some of the higher-level operations, and I made a tool called e2access that is able to populate a filesystem image from a normal program. This tool, somewhat reminiscent of the mtools suite that was popular at one time to allow normal users to access floppy disks on a system, is actually a fairly useful thing to have, and I remain surprised that there isn’t anything like it in common use. In any case, e2access allows me to populate images for use in L4Re, but I then thought that an equivalent to it would also be useful in L4Re for testing purposes. Consequently, a tool called fsaccess was created, but unlike e2access it does not use libe2access or libext2fs directly: instead, it uses the “client” filesystem library, exercising filesystem access via the IPC system and filesystem server architecture.
Ultimately, testing will be done completely normally using C library functions, these wrapping the “client” library. At that point, there will be no distinction between programs running within L4Re and within Unix. To an extent, L4Re already supports normal Unix-like programs using C library functions, this being particularly helpful when developing all this functionality, but of course it doesn’t support “proper” filesystems or Unix-like functionality in a particularly broad way, with various common C library or POSIX functions being stubs that do nothing. Of course, all this effort started out precisely to remedy these shortcomings.
Paging, Loading and Running Programs
Beyond explicitly performed file access, the next level of mutually-reinforcing testing and development came about through the simple desire to have a more predictable testing environment. In wanting to be able to perform tests sequentially, I needed control over the initiation of programs and to be able to rely on their completion before initiating successive programs. This may well be possible within L4Re’s Lua-based scripting environment, but I generally find the details to be rather thin on the ground. Besides, the problem provided some motivation to explore and understand the way that programs are launched in the environment.
There is some summary-level information about how programs (or tasks) are started in L4Re – for example, pages 41 onwards of “Memory, IPC, and L4Re” – but not much in the way of substantial documentation otherwise. Digging into the L4Re libraries yielded a confusing array of classes and apparent interactions which presumably make sense to anyone who is already very familiar with the specific approach being taken, as well as the general techniques being applied, but it seems difficult for outsiders to distinguish between the specifics and the generalities.
Nevertheless, some ideas were gained from looking at the code for various L4Re components including Moe (the root task), Ned (the init program), the loader and utilities libraries, and the oddly-named l4re_kernel component, this actually providing the l4re program which itself hosts actual programs by providing the memory management functionality necessary for those programs to work. In fact, we will eventually be looking at a solution that replicates that l4re program.
A substantial amount of investigation and testing took place to explore the topic. There were a number of steps required to initialise a new program:
- Open the program executable file and obtain details of the different program segments and the program’s start address, this requiring some knowledge of ELF binaries.
- Initialise a stack for the program containing the arguments to be presented to it, plus details of the program’s environment. The environment is of particular concern.
- Create a task for the program together with a thread to begin execution at the start address, setting the stack pointer to the appropriate place in where the stack should be made available.
- Initialise a control block for the thread.
- Start the thread. This should immediately generate a page fault because the memory at the start address is not yet available within the task.
- Service page faults for the program, providing pages for the program code – thus resolving that initial page fault – as well as for the stack and other regions of memory.
Naturally, each of these steps entails a lot more work than is readily apparent. Particularly the last step is something of an understatement in terms of what is required: the mechanism by which demand paging of the program is to be achieved.
L4Re provides some support for inspecting ELF binaries in its utilities library, but I found the ELF specification to be very useful in determining the exact purposes of various program header fields. For more practical guidance, the OSDev wiki page about ELF provides an explanation of the program loading process, along with how the different program segments are to be applied in the initialisation of a new program or process. With this information to hand, together with similar descriptions in the context of L4Re, it became possible to envisage how the address space of a new program might be set up, determining which various parts of the program file might be installed and where they might be found. I wrote some test programs, making some use of the structures in the utilities library, but wrote my own functions to extract the segment details from an ELF binary.
I found a couple of helpful resources describing the initialisation of the program stack: “Linux x86 Program Start Up” and “How statically linked programs run on Linux”. These mainly demystify the code that is run when a program starts up, setting up a program before the user’s main function is called, giving a degree of guidance about the work required to set up the stack so that such code may perform as expected. I was, of course, also able to study what the various existing L4Re components were doing in this respect, although I found the stack abstractions used to be idiomatic C/C++ bordering on esoteric. Nevertheless, the exercise involves obtaining some memory that can eventually be handed over to the new program, populating that memory, and then making it available to the new program, either immediately or on request.
Although I had already accumulated plenty of experience passing object capabilities around in L4Re, as well as having managed to map memory between tasks by sending the appropriate message items, the exact methods of setting up another task with memory and capabilities had remained mysterious to me, and so began another round of experimentation. What I wanted to do was to take a fairly easy route to begin with: create a task, populate some memory regions containing the program code and stack, transfer these things to the new task (using the l4_task_map function), and then start the thread to run the program, just to see what happened. Transferring capabilities was fairly easily achieved, and the L4Re libraries and frameworks do employ the equivalent of l4_task_map in places like the Remote_app_model class found in libloader, albeit obfuscated by the use of the corresponding C++ abstractions.
Frustratingly, this simple approach did not seem to work for the memory, and I could find only very few cases of anyone trying to use l4_task_map (or its equivalent C++ incantations) to transfer memory. Despite the memory apparently being transferred to the new task, the thread would immediately cause a page fault. Eventually, a page fault is what we want, but that would only occur because no memory would be made available initially, precisely because we would be implementing a demand paging solution. In the case of using l4_task_map to set up program memory, there should be no new “demand” for pages of such memory, this demand having been satisfied in advance. Nevertheless, I decided to try and get a page fault handler to supply flexpages to resolve these faults, also without success.
Having checked and double-checked my efforts, an enquiry on the l4-hackers list yielded the observation that the memory I had reserved and populated had not been configured as “executable”, for use by code in running programs. And indeed, since I had relied on the plain posix_memalign function to allocate that memory, it wasn’t set up for such usage. So, I changed my memory allocation strategy to permit the allocation of appropriately executable memory, and fortunately the problem was solved. Further small steps were then taken. I sought to introduce a region mapper that would attempt to satisfy requests for memory regions occurring in the new program, these occurring because a program starting up in L4Re will perform some setting up activities of its own. These new memory regions would be recognised by the page fault handler, with flexpages supplied to resolve page faults involving those regions. Eventually, it became possible to run a simple, statically-linked program in its own task.

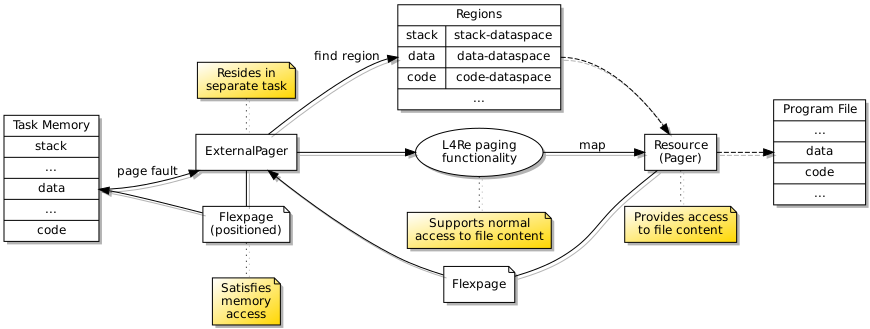
When loading and running a new program, an external page fault handler makes sure that accesses to memory are supported by memory regions that may be populated with file content.
Up to this point, the page fault handler had been external to the new task and had been supplying memory pages from its own memory regions. Requests for data from the program file were being satisfied by accessing the appropriate region of the file, this bringing in the data using the file’s paging mechanism, and then supplying a flexpage for that part of memory to the program running in the new task. This particular approach compels the task containing the page fault handler to have a memory region dedicated to the file. However, the more elegant solution involves having a page fault handler communicating directly with the file’s pager component which will itself supply flexpages to map the requested memory pages into the new task. And to be done most elegantly, the page fault handler needs to be resident in the same task as the actual program.
Putting the page fault handler and the actual program in the same task demanded some improvements in the way I was setting up tasks and threads, providing capabilities to them, and so on. Separate stacks need to be provided for the handler and the program, and these will run in different threads. Moving the page fault handler into the new task is all very well, but we still need to be able to handle page faults that the “internal” handler might cause, so this requires us to retain an “external” handler. So, the configuration of the handler and program are slightly different.
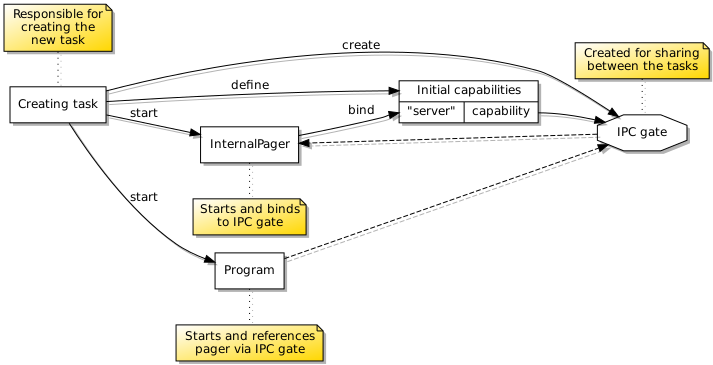
Another tricky aspect of this arrangement is how the program is configured to send its page faults to the handler running alongside it – the internal handler – instead of the one servicing the handler itself. This requires an IPC gate to be created for the internal handler, presented to it via its configuration, and then the handler will bind to this IPC gate when it starts up. The program may then start up using a reference to this IPC gate capability as its “pager” or page fault handler. You would be forgiven for thinking that all of this can be quite difficult to orchestrate correctly!

An IPC gate must be created and presented to the page fault handler for it to bind to before it is presented to the program as its “pager”.
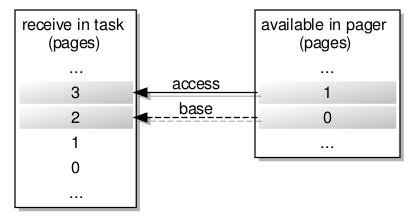
Although I had previously been sending flexpages in messages to satisfy map requests, the other side of such transactions had not been investigated. Senders of map requests will specify a “receive window” to localise the placement of flexpages returned from such requests, this being an intrinsic part of the flexpage concept. Here, some aspects of the IPC system became more prominent and I needed to adjust the code generated by my interface description language tool which had mostly ignored the use of message buffer registers, employing them only to control the reception of object capabilities.
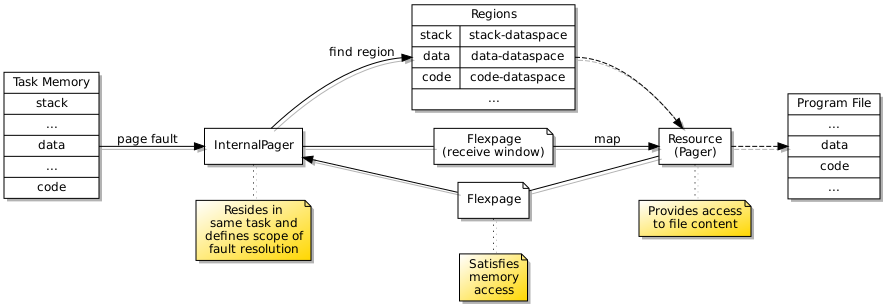
More testing was required to ensure that I was successfully able to request the mapping of memory in a particular region and that the supplied memory did indeed get mapped into the appropriate place. With that established, I was then able to modify the handler deployed to the task. Since the flexpage returned by the dataspace (or resource) providing access to file content effectively maps the memory into the receiving task, the page fault handler does not need to explicitly return a valid flexpage: the mapping has already been done. The semantics here were not readily apparent, but this approach appears to work correctly.

An internal page fault handler satisfies accesses to memory from the program running in the same task, providing it with access to memory regions that may be populated with file content.
One other detail that proved to be important was that of mapping file content to memory regions so that they would not overlap somehow and prevent the correct region from being used to satisfy page faults. Consider the following regions of the test executable file described by the readelf utility (with the -l option):
  Type           Offset             VirtAddr           PhysAddr
                 FileSiz            MemSiz              Flags  Align
  LOAD           0x0000000000000000 0x0000000001000000 0x0000000001000000
                 0x00000000000281a6 0x00000000000281a6  R E    0x1000
  LOAD           0x0000000000028360 0x0000000001029360 0x0000000001029360
                 0x0000000000002058 0x0000000000008068  RW     0x1000
Here, we need to put the first region providing the program code at a virtual address of 0x1000000, having a size of at least 0x281a6, populated with exactly that amount of content from the file. Meanwhile, we need to put the second region at address 0x1029360, having a size of 0x8068, but only filled with 0x2058 bytes of data. Both regions need to be aligned to addresses that are multiples of 0x1000, but their contents must be available at the stated locations. Such considerations brought up two apparently necessary enhancements to the provision of file content: the masking of content so that undefined areas of each region are populated with zero bytes, this being important in the case of the partially filled data region; the ability to support writes to a region without those writes being propagated to the original file.
The alignment details help to avoid the overlapping of regions, and the matter of populating the regions can be managed in a variety of ways. I found that since file content was already being padded at the extent of a file, I could introduce a variation of the page mapper already used to manage the population of memory pages that would perform such padding at the limits of regions defined within files. For read-only file regions, such a “masked” page mapper would issue a single read-only page containing only zero bytes for any part of a file completely beyond the limits of such regions, thus avoiding the allocation of lots of identical pages. For writable regions that are not to be committed to the actual files, a “copied” page mapper abstraction was introduced, this providing copy-on-write functionality where write accesses cause new memory pages to be allocated and used to retain the modified data.
Some packaging up of the functionality into library routines and abstractions was undertaken, although as things stand more of that still needs to be done. I haven’t even looked into support for dynamic library loading, nor am I handling any need to extend the program stack when that is necessary, amongst other things, and I also need to make the process of creating tasks as simple as a function call and probably also expose the process via IPC in order to have a kind of process server. I still need to get back to addressing the lack of convenient support for the sequential testing of functionality.
But I hope that much of the hard work has now already been done. Then again, I often find myself climbing one particular part of this mountain, thinking that the next part of the ascent will be easier, only to find myself confronted with another long and demanding stretch that brings me only marginally closer to the top! This article is part of a broader consolidation process, along with writing some documentation, and this process will continue with the packaging of this work for the historical record if nothing else.
Conclusions and Reflections
All of this has very much been a learning exercise covering everything from the nuts and bolts of L4Re, with its functions and abstractions, through the design of a component architecture to support familiar, intuitive but hard-to-define filesystem functionality, this requiring a deeper understanding of Unix filesystem behaviour, all the while considering issues of concurrency and resource management that are not necessarily trivial. With so much going on at so many levels, progress can be slow and frustrating. I see that similar topics and exercises are pursued in some university courses, and I am sure that these courses produce highly educated people who are well equipped to go out into the broader world, developing systems like these using far less effort than I seem to be applying.
That leads to the usual question of whether such systems are worth developing when one can just “use Linux” or adopt something already under development and aimed at a particular audience. As I note above, maybe people are routinely developing such systems for proprietary use and don’t see any merit in doing the same thing openly. The problem with such attitudes is that experience with the development of such systems is then not broadly cultivated, the associated expertise and the corresponding benefits of developing and deploying such systems are not proliferated, and the average user of technology only gets benefits from such systems in a limited sense, if they even encounter them at all, and then only for a limited period of time, most likely, before the products incorporating such technologies wear out or become obsolete.
In other words, it is all very well developing proprietary systems and celebrating achievements made decades ago, but having reviewed decades of computing history, it is evident to me that achievements that are not shared will need to be replicated over and over again. That such replication is not cutting-edge development or, to use the odious term prevalent in academia, “novel” is not an indictment of those seeking to replicate past glories: it is an indictment of the priorities of those who commercialised them on every prior occasion. As mundane as the efforts described in this article may be, I would hope that by describing them and the often frustrating journey involved in pursuing them, people may be motivated to explore the development of such systems and that techniques that would otherwise be kept as commercial secrets or solutions to assessment exercises might hopefully be brought to a broader audience.
